I presented the following session at NICAR 2025 in Minneapolis:
Elevate your graphics with Illustrator
Vector graphics programs like Illustrator are great tools for creating beautiful, unique data visualizations and graphics – but it doesn’t need to all be done from scratch. In this session, we will go over ways to begin making your chart using tools that most newsrooms already use (like Datawrapper, RawGraphs, Flourish and ggplot) and elevate its design with the magic of SVGs and vector graphics programs. This session is good for journalists with some data and data visualization knowledge. Attendees will need to bring their own laptop for the training.
Here is the handout from the presentation
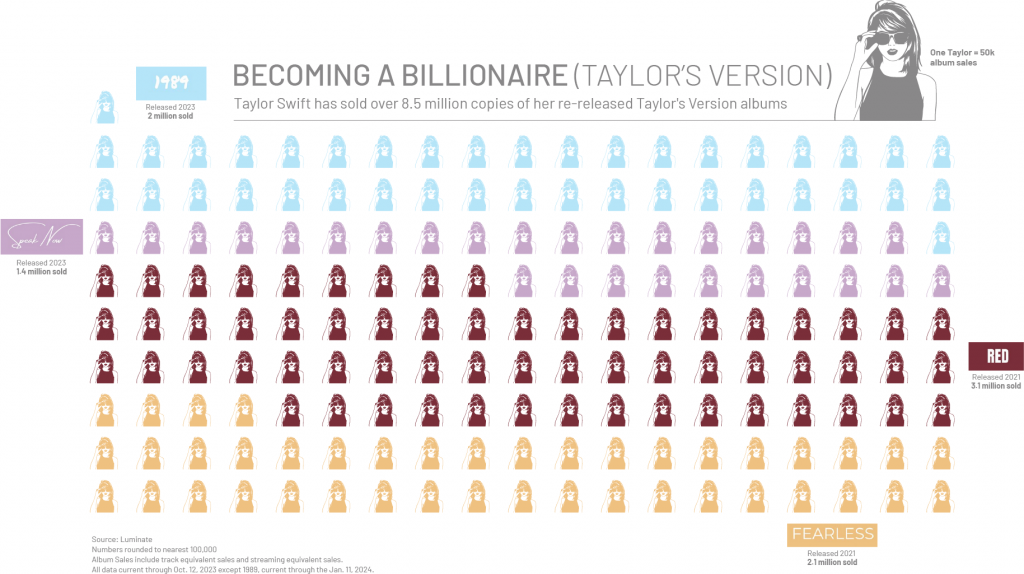
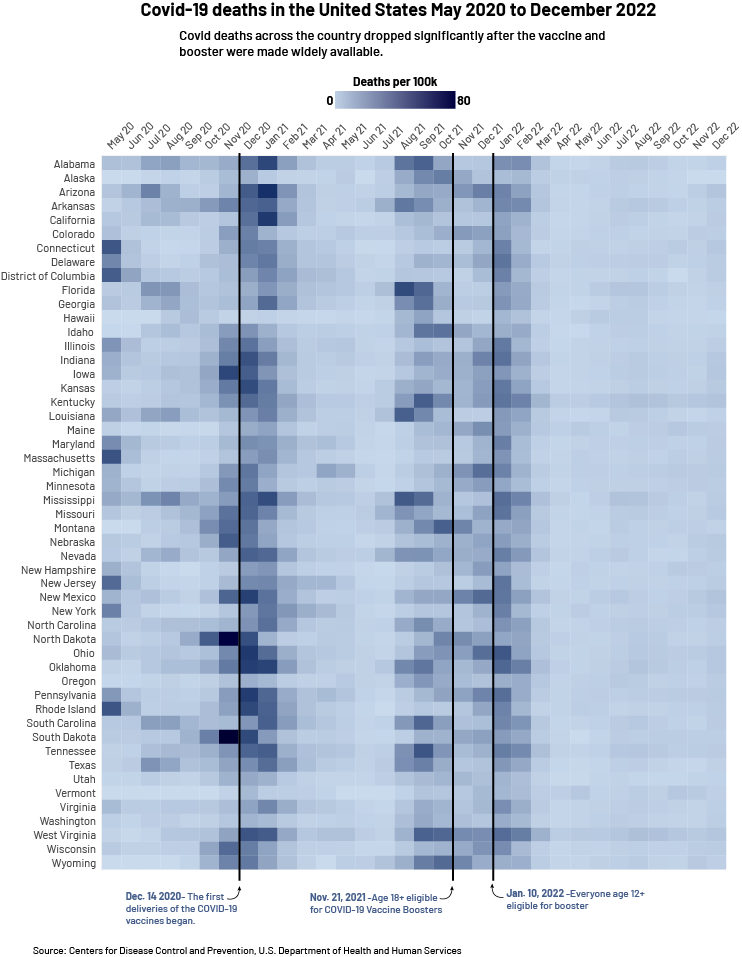
I showed attendees how to create the following two graphics: