- April 09, 2015
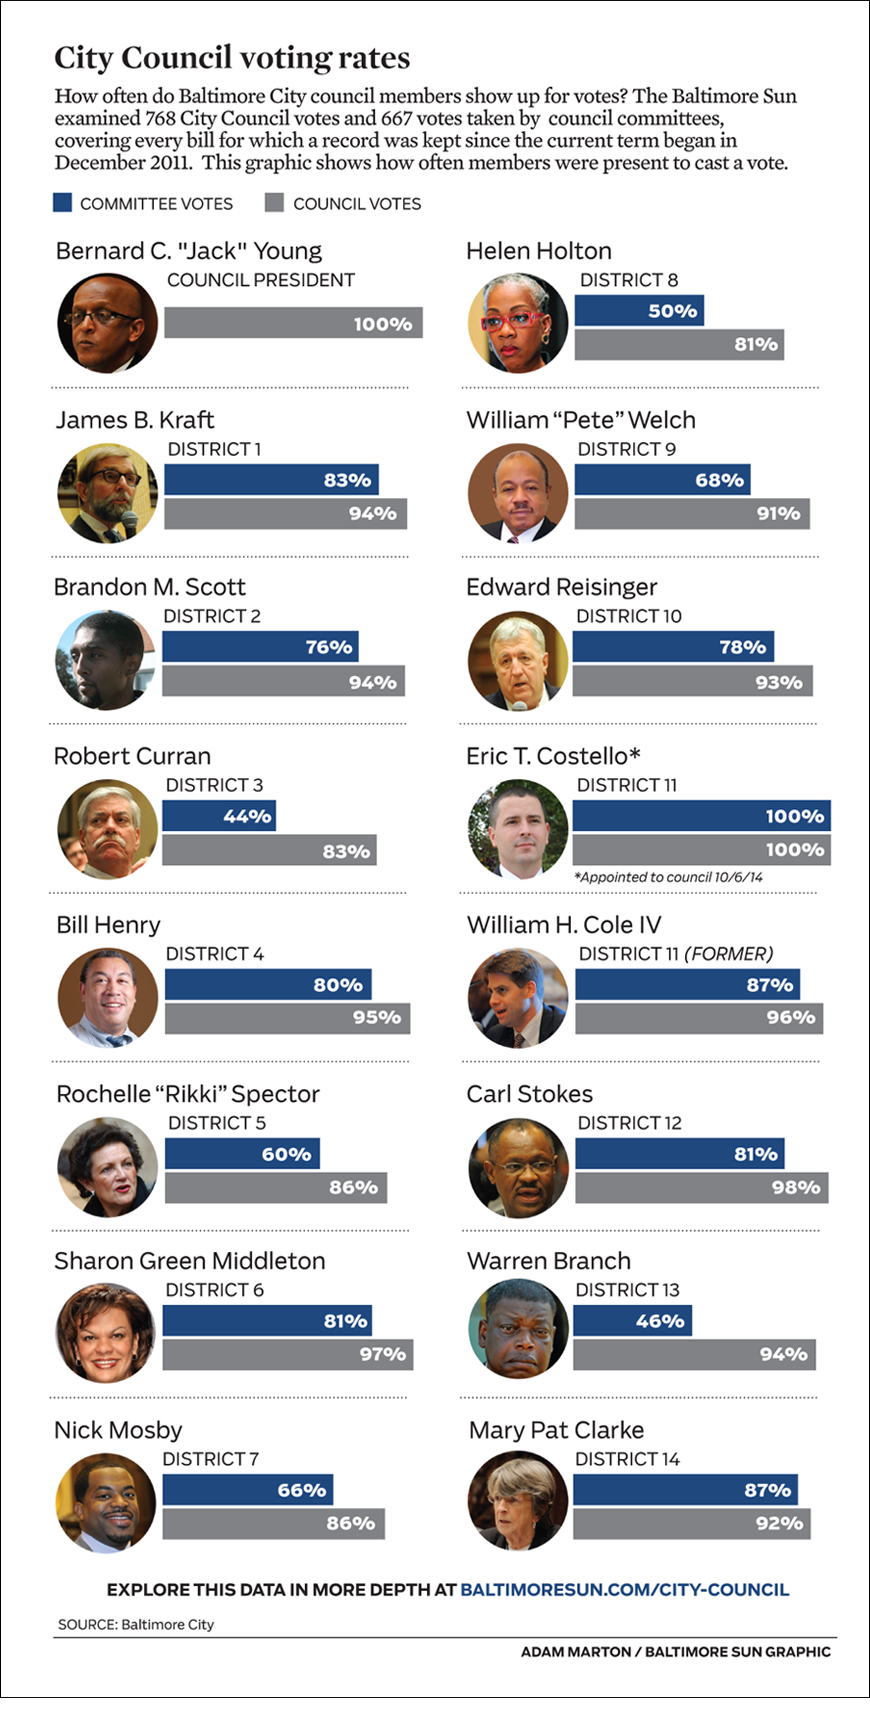
Graphic: How often do Baltimore City council members show up for votes?
The Baltimore Sun examined 768 City Council votes and 667 votes taken by council committees, covering every bill for which a record was kept since the current term began in December 2011. This graphic shows how often members were present to cast a vote. Voting attendance varies wildly. Robert Curran of District 3 in Northeast Baltimore has missed 66% of his committee votes, attending only 48 of 109 votes.
I created two separate graphics to visualize this data. One for online and one for print (seen left).
It is always a pleasure dealing with data that comes directly from reporters as a result of an investigation. The full story, by Luke Broadwater and Yvonne Wenger, is no longer hosted online.